What AMC Data Shows: 12 Findings From 10 Consumable Brands
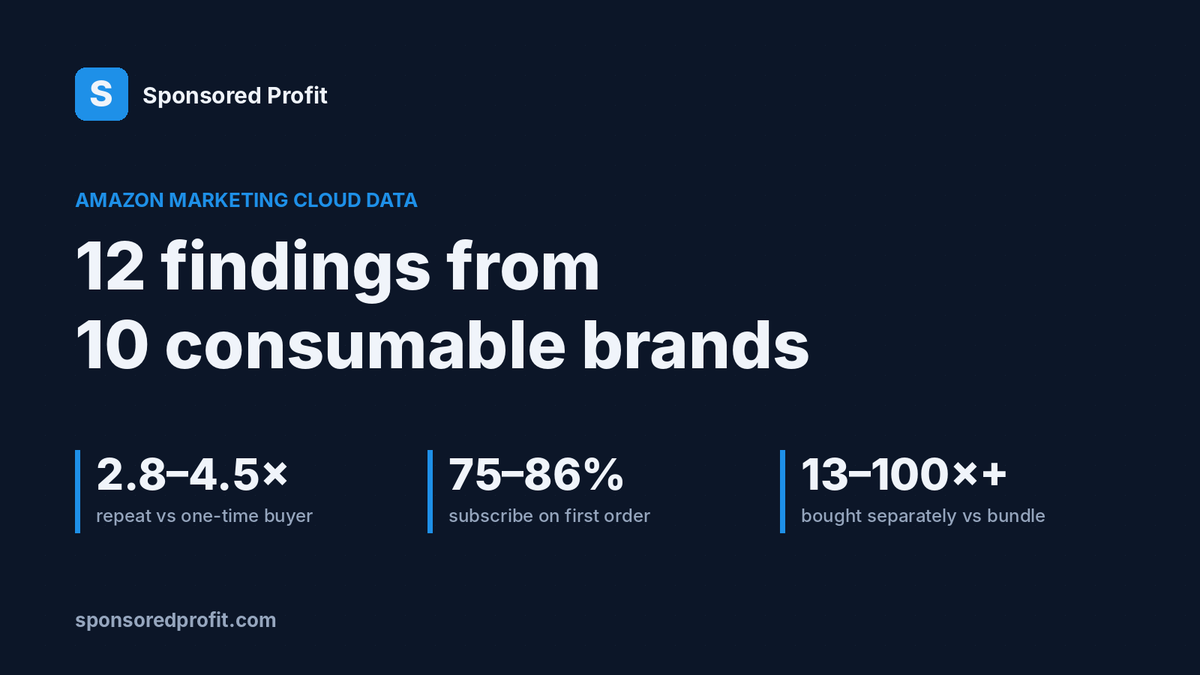
Three months of Amazon Marketing Cloud analysis across around ten consumable brands, boiled down to 12 numbers. Free to quote with a link back.

Most of what gets written about Amazon advertising is opinion. This page is data.
Between July and September 2026 I ran Amazon Marketing Cloud (AMC) customer-value analyses for around ten consumable brands and fifteen hero products, mostly on Amazon UK. The set covers Seller Central and Vendor Central accounts in supplements, personal care, hygiene consumables, life-stage products and accessories.
Below are the findings that came up again and again. Every brand and product is anonymised. Figures are ranges across the brands, not averages from one account.
Using these figures? You're welcome to quote any number on this page in your own article, report or presentation. Please credit Sponsored Profit and link back to this page.
The findings at a glance
| # | Finding | Figure |
|---|---|---|
| 1 | Value of a repeat buyer vs a one-time buyer | 2.8–4.5× |
| 2 | Extra value when a repeat buyer also subscribes | +15% to +55% |
| 3 | Subscribers who sign up on their first order | 75–86% |
| 4 | Fall in first-order Subscribe & Save sign-up rate after April 2026 | 29–45% (relative) |
| 5 | Ad-attributed purchases that went to existing customers (several products) | 33–55% |
| 6 | New-to-brand share on branded keywords | 41–49% |
| 7 | Cost per new customer, isolated vs bundled product targeting | About half |
| 8 | Value of cross-purchasers vs single-product customers | 2–5× |
| 9 | Pairs bought separately vs as a bundle | 13× to over 100× |
| 10 | Reorder gap on a 30-day pack, non-subscribers | ~66 days |
| 11 | How much first-order ROAS understated break-even ACoS | 1.5–2× |
| 12 | Range of LTV:CAC across products | 0.4× to 7.5× |
1. The second order is worth more than the subscription
On every Seller Central consumable in the set, a customer who came back for a second order was worth 2.8 to 4.5 times as much as a one-time buyer.
A repeat buyer who then subscribed to Subscribe & Save added only another 15% to 55%.
So the biggest lever for most consumable brands isn't the subscription. It's the second purchase. More on this in how to calculate Amazon customer lifetime value.
2. Subscriptions are won on the first order
Between 75% and 86% of subscribers signed up on their very first order, and 88% to 94% had done so by their second.
A customer who has reordered by hand two or three times has usually already decided against subscribing. They're a reorder audience, not a subscription audience.
3. Amazon's April 2026 change cut first-order sign-ups
Amazon used to pre-select Subscribe & Save in the buy box. Customers now have to choose it. In the UK data, the break showed up in April 2026.
First-order subscription rates fell on every Seller Central product measured:
| Product type | Relative fall in first-order subscription rate |
|---|---|
| Adult daily tablet (mature product) | about −45% (overlapped with a voucher cut) |
| Daily personal-care consumable | about −40% |
| Daily children's supplement | about −35% |
| Adult daily tablet (trial-heavy) | about −35% |
| Course supplement | about −34% |
| Daily powder supplement | about −29% |
It hit organic and ad-acquired customers alike. On two products, total subscriptions kept rising only because new-customer numbers grew strongly. The rate per new customer had still fallen by a third.
Any Subscribe & Save comparison that spans April 2026 mixes two different worlds. Full detail in what the data shows about Subscribe & Save.
4. Ads often re-buy customers the brand already has
On several products, between 33% and 55% of ad-attributed purchases went to customers the brand already had.
The share of new-to-brand customers followed the same order by targeting type in every account:
| Targeting type | New-to-brand share of ad purchases |
|---|---|
| Category and competitor product targeting | 73–83% |
| Generic keywords | 67–72% |
| Auto campaigns | 62–67% |
| Targeting your own product pages | 41–61% |
| Branded keywords | 41–49% |
On one product, branded search made up half of all ad-attributed purchases, at the lowest new-to-brand rate in the account.
5. Campaign structure changes what a new customer costs
Competitor ASINs targeted in their own single-target campaigns won new customers at about half the cost of the same targets bundled into one campaign. Part of that is because the winners are the ones that get isolated, but the gap was big and consistent.
In the same account, spend on those isolated campaigns had fallen by about three-quarters year on year, despite them having the best cost per new customer in the account.
Head terms were the other surprise. One big generic keyword cost about 1.9 times as much per new customer as a more specific term. More in the new-to-brand guide.
6. Cross-sell is the most overlooked lever
Customers who bought more than one product from the range were worth 2 to 5 times as much as single-product customers. Yet roughly 9 in 10 customers never cross-bought.
The bundles customers clearly want usually already exist. Hardly anyone finds them. Pairs bought separately outnumbered bundle purchases by 13 times to over 100 times.
7. Customers reorder late
On a daily supplement sold in 30-day packs:
| Customer type | Average gap between orders |
|---|---|
| Subscribers | ~41 days |
| Non-subscribers | ~66 days |
Non-subscribers were going without the product for more than half the year. Reorder ads timed to the pack size start too late and stop too early. See Amazon reorder cycles.
8. First-order ROAS hides what you can afford
For low-price, high-loyalty products, first-order ROAS understated the break-even ACoS by 1.5 to 2 times once lifetime value was included.
Non-branded campaigns that looked unprofitable at 45–49% ACoS paid back within 8 to 9 months.
9. Sometimes the answer is to spend less
LTV:CAC ranged from 0.4× to 7.5× across products. On the weakest line, paid acquisition lost money at any volume.
Customer-value analysis doesn't always say "spend more". Sometimes the most useful finding is where to stop.
Subscribe & Save in numbers
| Metric | Range observed |
|---|---|
| Monthly subscription churn | 6–22% (lowest on daily habit products, highest on course products) |
| Subscriptions held per subscriber | 1.23–1.32 |
| Subscriptions that took only one delivery | 27–38% |
| Organic vs ad-acquired subscription rate | Organic customers subscribed at 1.15–1.83× the rate |
One voucher test showed how non-linear the response can be:
| First-order Subscribe & Save voucher | Sign-up rate |
|---|---|
| None | ~8.5% |
| 15% | ~9.2% |
| 20% | ~12.6% |
| 25% | ~18.2% |
The voucher stacks on the standing Subscribe & Save discount, so a 25% voucher came through at about 31.6% in practice.
Methodology
- Period: July to September 2026.
- Scope: around ten consumable brands and fifteen hero products, mostly Amazon UK. Seller Central (3P) and Vendor Central (1P) accounts.
- Categories: supplements, personal care, hygiene consumables, life-stage products and accessories.
- Data: Amazon Marketing Cloud, using Amazon Retail Purchases (up to five years of purchase history), Flexible Shopping Insights (subscription data) and ad-attributed conversion events.
- Anonymisation: no brand, product or ASIN is named. Figures are shown as ranges.
Caveats. These are correlations, not controlled experiments. Ad attribution is last-touch. Subscriber and cross-purchaser premiums are upper bounds, because those customers choose themselves. Your own numbers will be different, which is the point of measuring them.
Measure your own
Quick estimate: the free Amazon LTV calculator shows your lifetime value, payback month and lifetime break-even ACoS from a few numbers.
The real figures: I'm running a fixed-price AMC Customer Value Snapshot for 5 founding clients. Amazon's five-year purchase data in AMC is free to query until 31 December 2026, so applications close at the end of November.
Want more like this? Subscribe free for practical, data-backed guides to growing a consumable brand on Amazon.